
“Progress isn’t a straight line upward. But a pattern — sustained, across every grade and every test — that’s not luck. That’s a system doing what it was designed to do.”
This report exists for one reason: you deserve to know how your children are performing. Not in vague terms. Not in carefully worded reassurances. In actual data, compared against 22 districts across northern New Jersey — nine that match our schools almost exactly in size, demographics, and household income, and twelve wealthier communities with higher property values and more resources. Both comparisons matter. If you want the unabridged picture, the numbers behind this post — unvarnished and in full — are here.
What follows is a genuine accounting. Academic performance across mathematics, literacy, and science was benchmarked against those 21 peer districts. Three years of Advanced Placement growth that tells a story not just about numbers but about access and opportunity expanding for more students. And the intervention strategies are driving continuous improvement. All of it, unvarnished.
Nine assessments in mathematics. Seven consecutive grade levels in English Language Arts. Three benchmark grades in science. In every single comparison, against districts facing the same challenges and districts with far greater resources, our students lead. Not by a point or two that could be explained away. By margins that hold up every time you stress-test them. In research terms, when a finding holds across multiple comparison groups like this, you know it’s legitimate. This isn’t cherry-picked data. This is a pattern of excellence, and it didn’t happen by accident.
It happened because the curriculum builds year after year. Because teachers know what came before and what comes next. Because expectations don’t waver when things get hard. Behind every percentage point is a child who can now read more challenging text, solve more complex problems, or access college-level coursework they might not have considered before. That’s what we’re really measuring — whether our students have the skills and opportunities they need to thrive.
Nowhere is that clearer than in our Advanced Placement program.
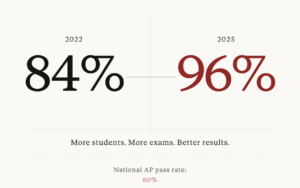
Three years ago, fewer than one in five Fair Lawn High School students took an AP course. Today it’s nearly one in four. Enrollment grew 28 percent. Exam volume grew 33 percent, meaning students aren’t dipping their toes in; they’re averaging 2.6 exams each. And the pass rate moved from 84 percent to 96 percent, exceeding the national average by 36 percentage points. More students. More exams. Better results. That’s not pushing students to fail. That’s preparing students to succeed.
None of what you’ve just read happened in isolation. It is the result of teachers who show up every day and refuse to settle. Support staff, from secretaries to bus drivers to custodians to paraprofessionals, who make everything else possible. Administrators and coaches who use evidence to guide decisions. A Board of Education invested in thoughtful oversight and continuous improvement. And families like yours, who are not just partners but are integral to this mission.
Above all, these results belong to your children — students who embraced challenge, arrived prepared, and demonstrated what our young people are capable of achieving.
This annual performance report is part one of a series. In the coming months, we’ll share deeper dives into our three district goals: Empowering Pathways to Excellence, Cultivating Belonging and Community, and Building Sustainable Foundations. Each includes specific strategies we’re implementing to ensure every student has what they need to succeed.
The data tells you where we are. The goals tell you where we’re going. Because being good isn’t good enough when our students deserve to be great.
Sincerely,


